
Know What’s Working.
Know What’s Not.
The AI-powered trading journal that helps traders uncover patterns, eliminate mistakes, and improve performance.
No complicated setup. Start building your trading history in minutes.
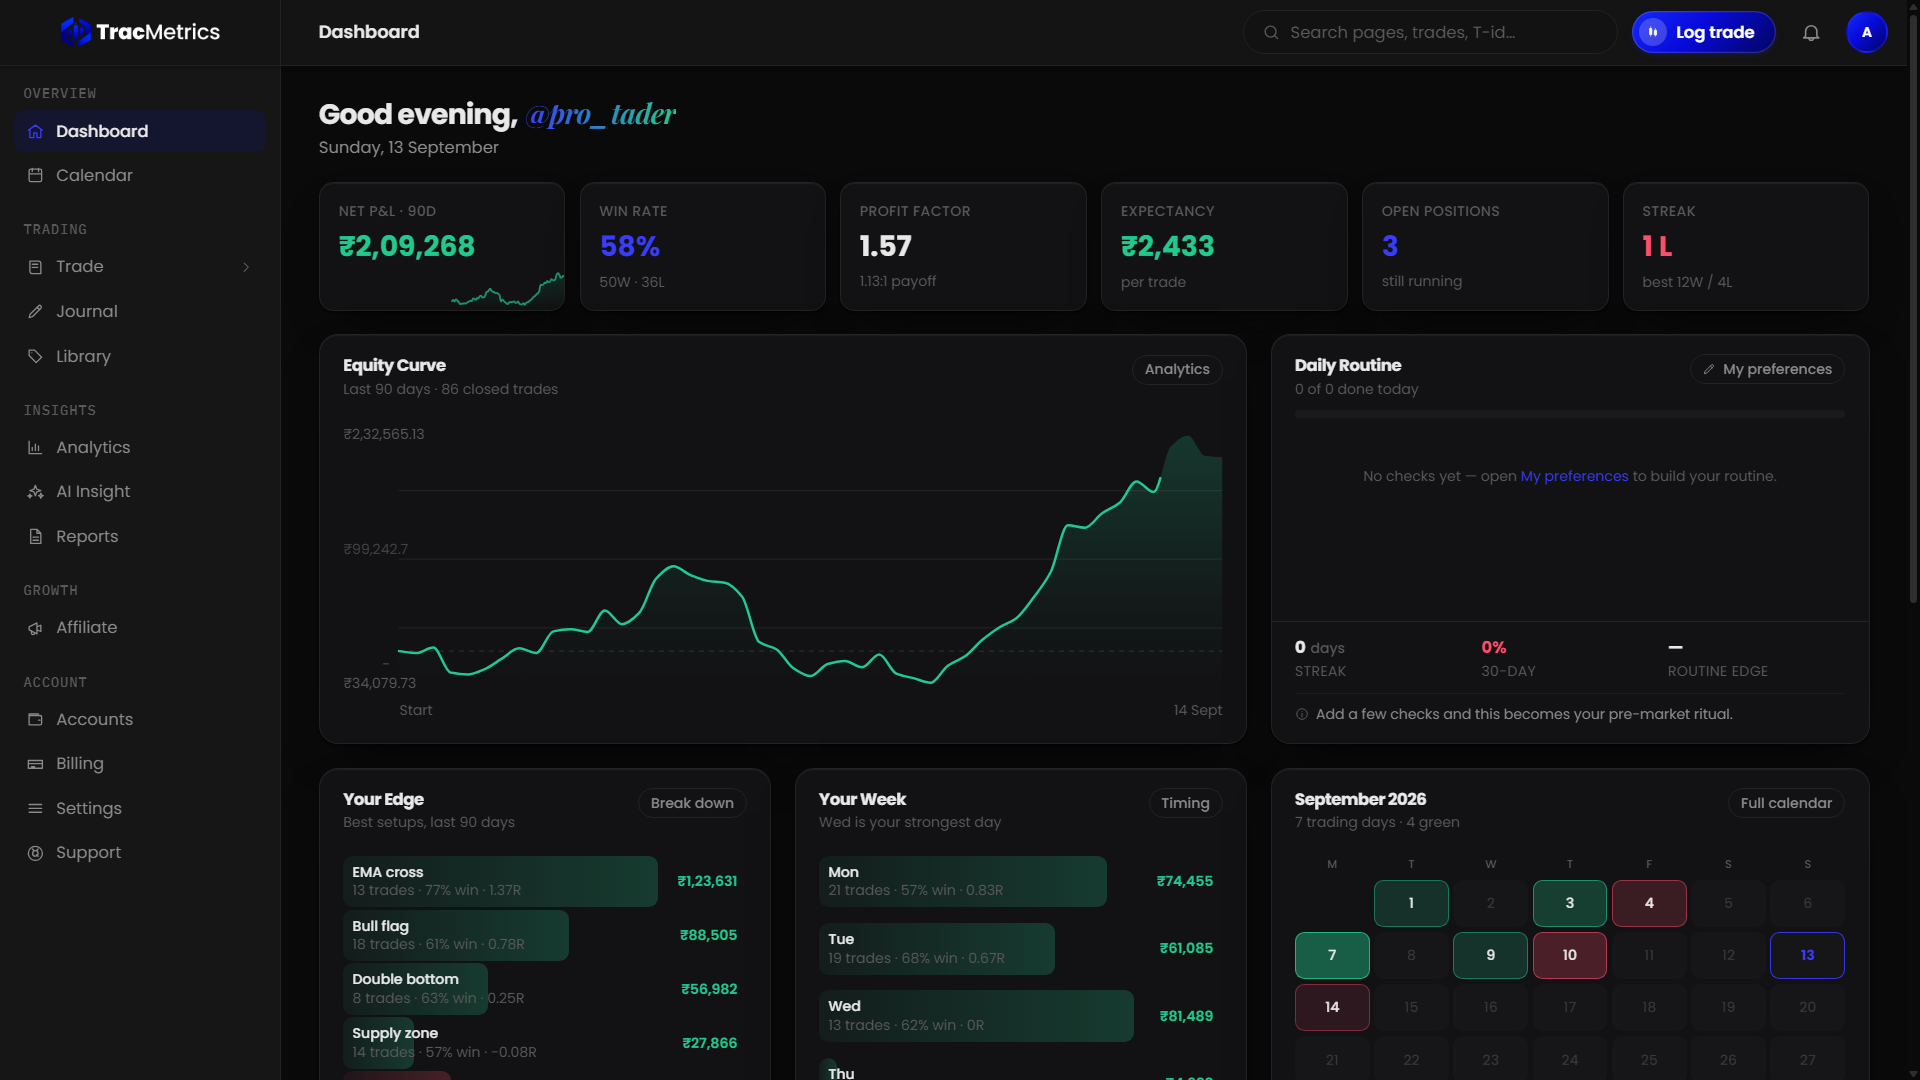
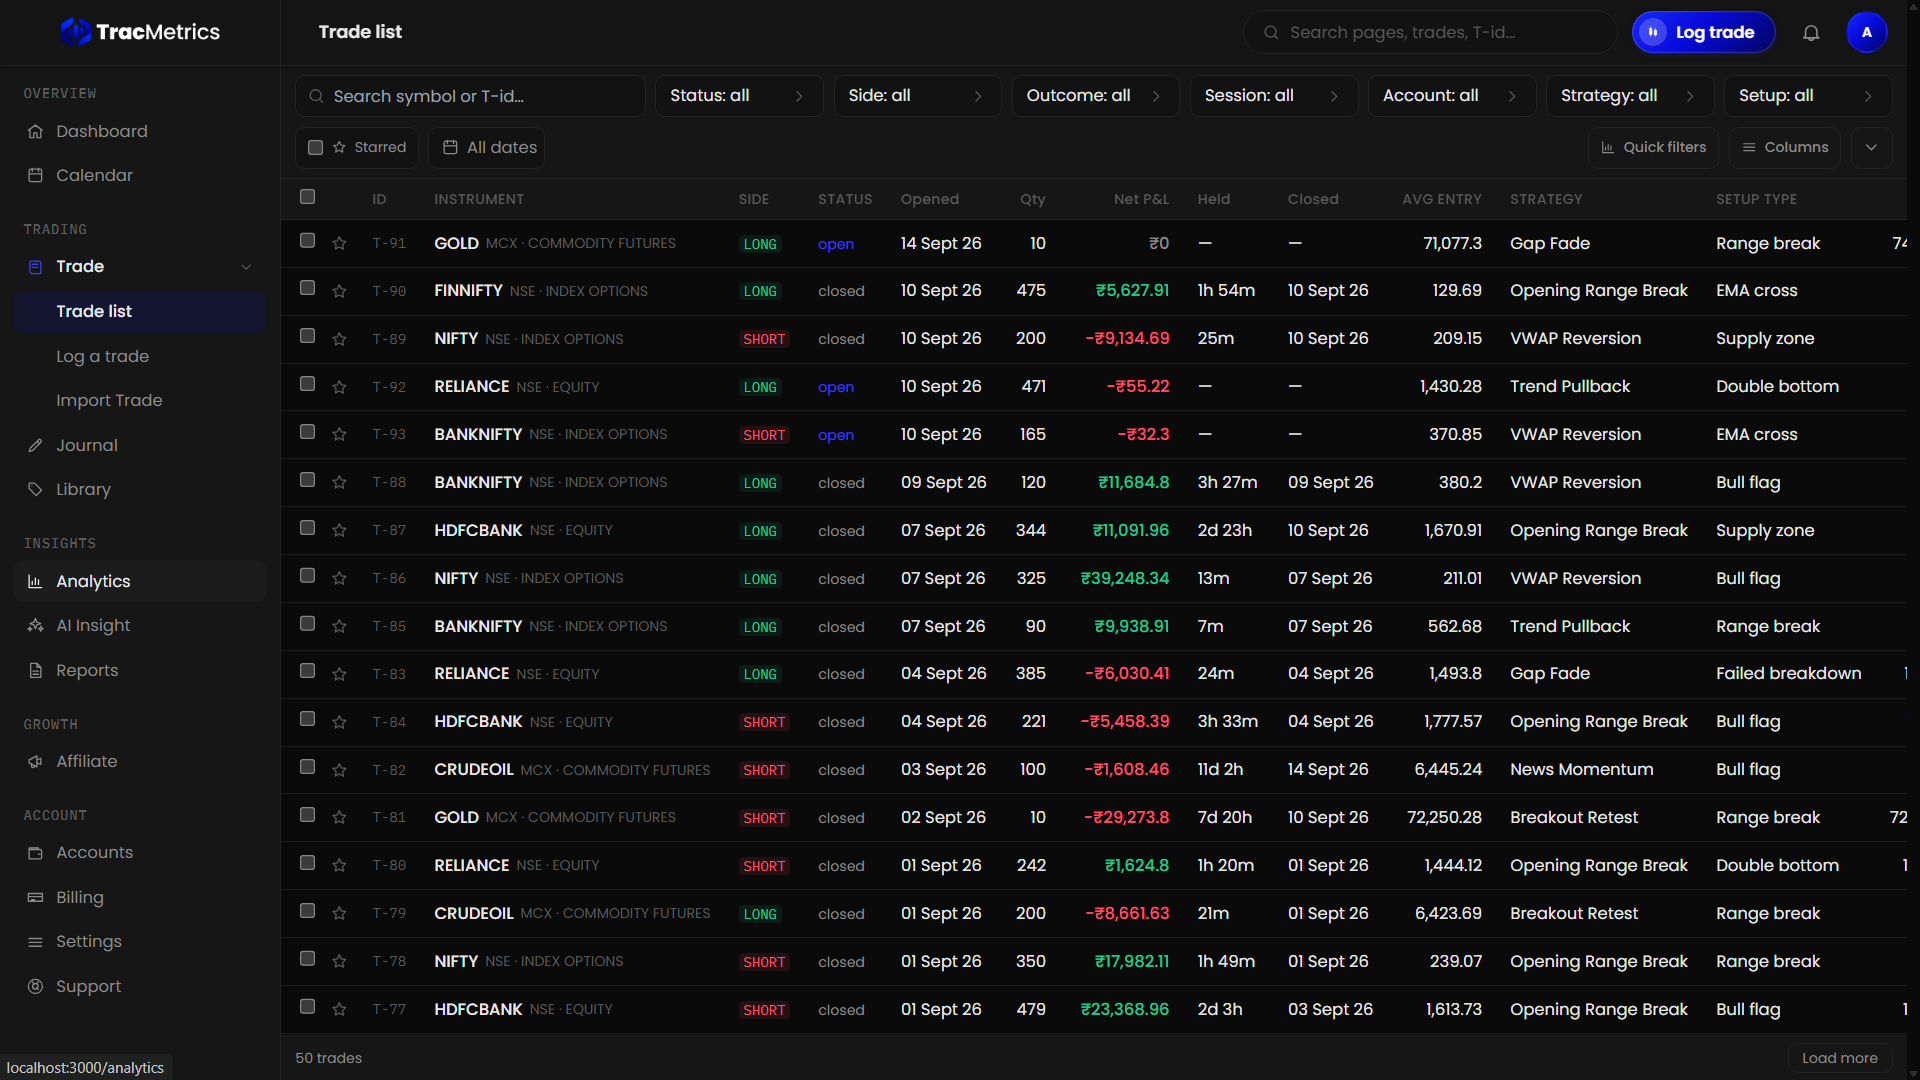
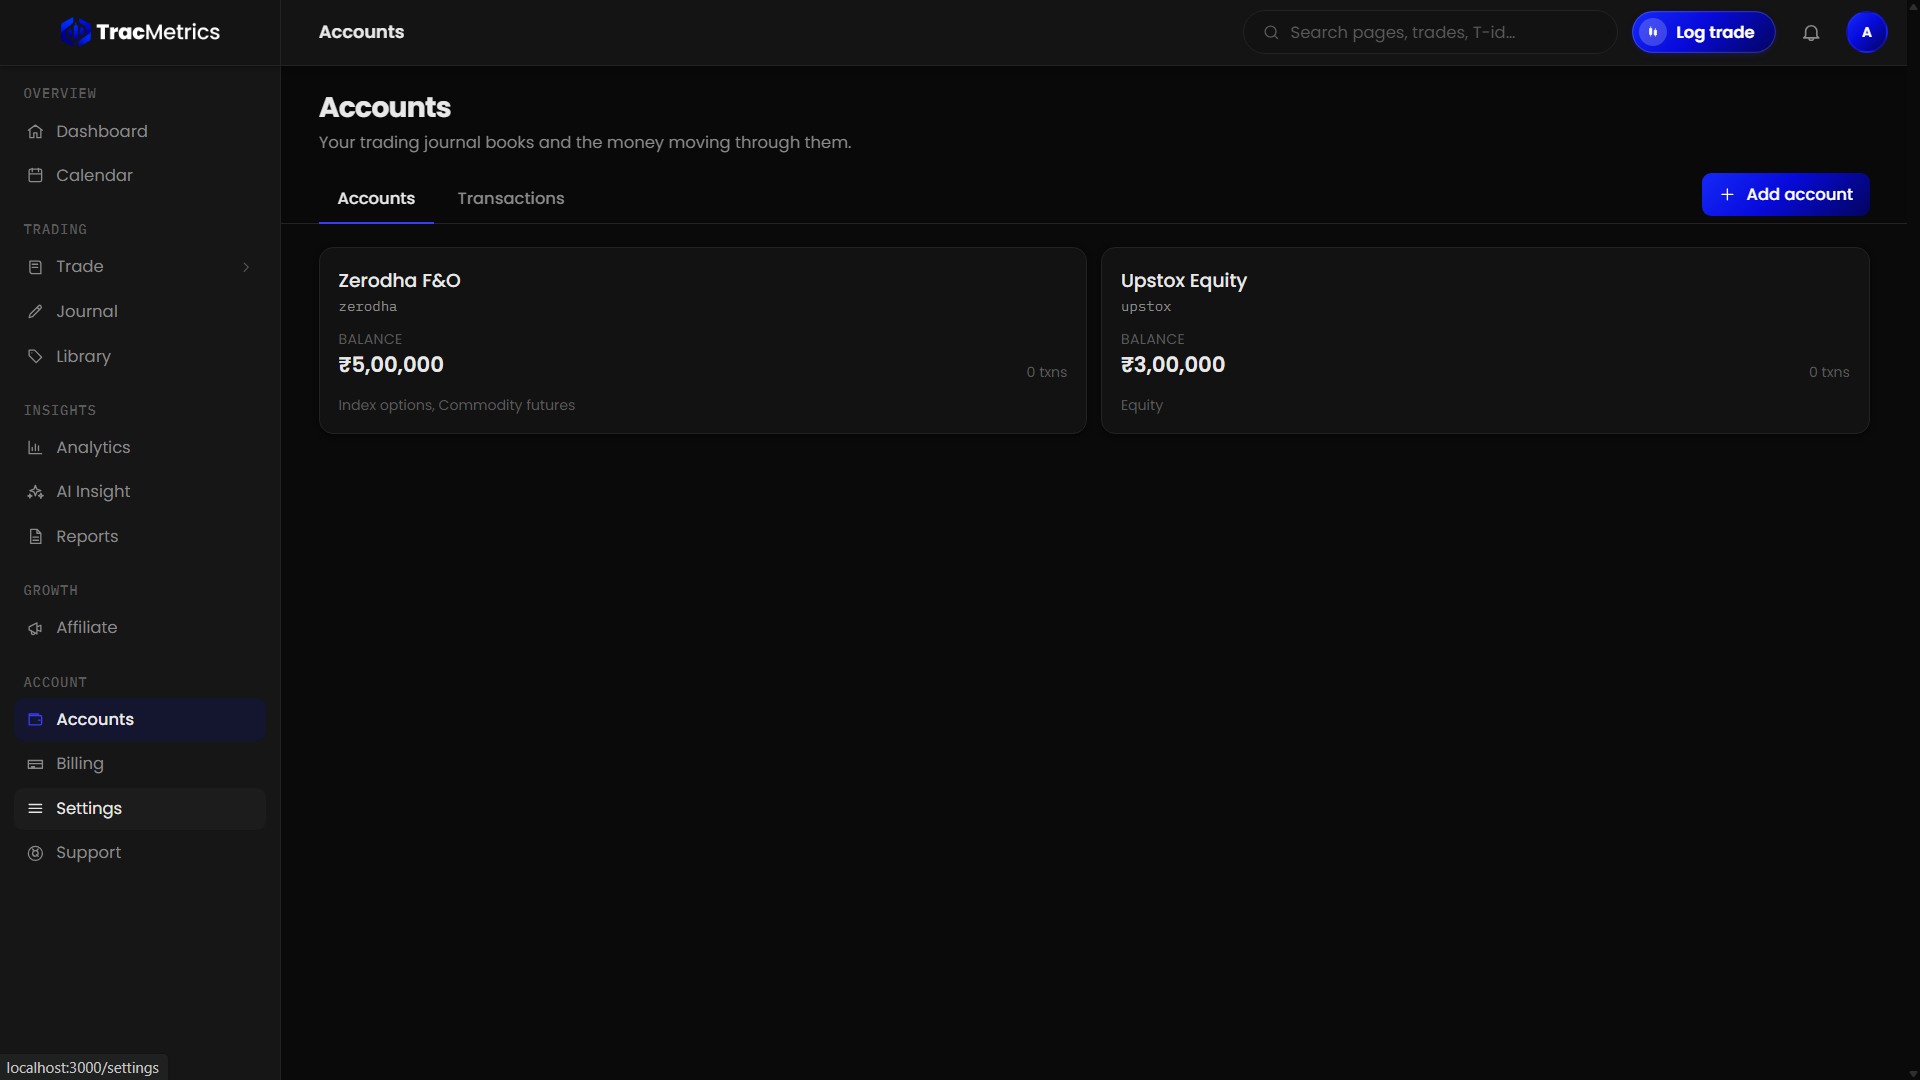
One dashboard. Your whole trading story.
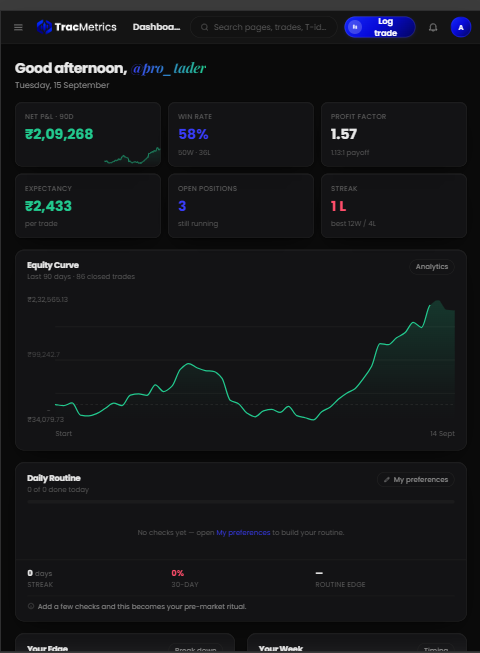
Net P&L, win rate, profit factor and your equity curve, together in one place. No more piecing your performance together from memory or scattered spreadsheets.
- Net P&L and win rate at a glance
- Equity curve, strategy and calendar together
- Every recent trade, right where you need it
Most Traders Know Their Results.
Very Few Know The Reason Behind Them.
You can see your P&L. But P&L doesn't tell you which setups make money, where discipline breaks down, what conditions hurt performance, or why the same mistakes keep returning.
You remember the outcome of a trade, but forget the reason you took it.
The same mistake appears again weeks later because nothing was documented.
You know one setup performs better, but can't measure it.
Winning trades get celebrated. Losing trades get remembered. Neither gets analyzed.
Your journal exists in screenshots, notes, spreadsheets, and memory.
You spend hours reviewing trades and still leave with no clear answer.
Track Every Trade In One Place
Whether you trade Equity, F&O, Commodity, Crypto, Intraday, or Swing positions, everything stays inside one journal.
Everything organized in a single workspace.
See performance across markets with real insights.
Spot patterns, improve discipline and grow consistently.
Your journal becomes your trading intelligence.
Every trade becomes data. Every data point becomes insight. Every insight becomes an opportunity to improve.
Record entries, exits, reasoning, notes, screenshots and emotions so nothing gets lost.
Every trade is organized, tagged and stored in one place. No more spreadsheets or scattered notes.
Measure performance across setups, symbols, strategies and market conditions.
Recurring mistakes, winning setups and the conditions behind them, surfaced automatically.
Track your progress, refine your strategy and build long-term consistency.
Find What Gives You an Edge.
These are the kinds of answers a full trading history gives you, drawn directly from what you logged, not from a hunch about how last month went.
Illustrative data shown for demonstration. Your own edges come from your own journal.
“I think this strategy works.”
68% win rate across 58 trades
“I think I overtrade.”
Performance drops 23% after the 4th trade
“My entries seem good.”
Average entry efficiency: 81%
“I lose more in afternoons.”
Afternoon session expectancy: -0.32R
“Which setup is best?”
Pullbacks produce 47% of total profits
From a feeling to a number.
The questions don’t change. What changes is whether you can actually answer them.
Your journal, wherever you are.
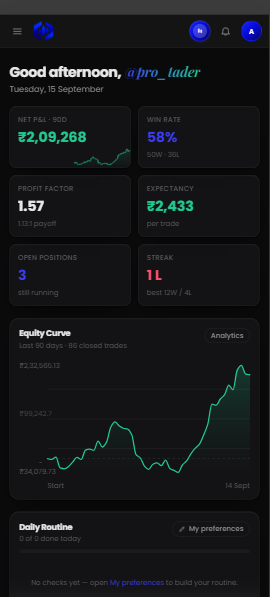
Log a trade from your desk between setups, or review your calendar from your phone at the end of the day.
Every trader’s story starts the same way.
From full-time traders to long-term investors, here’s how a structured journal changes the way people trade.
“I used to track everything across three notebooks and a spreadsheet I never actually kept updated. Now every trade goes into one journal, and I know which setups are working before the month is even over.”
“I trade around a full-time job, mostly swing positions with the occasional intraday trade. Logging takes a minute after I close a position, and by Sunday my whole week is laid out, win rate, R:R, all of it.”
“Options trading means multiple legs and constant adjustments, and that gets messy to track by hand. TracMetrics keeps the whole position together, so I can actually tell if a strategy is working across expiries instead of guessing.”
“I write down why I bought a stock the same day I buy it. Months later, when I'm deciding whether to hold or sell, I can check if that original reason still holds, with my full portfolio history sitting right next to it.”
“I run intraday setups in the morning and carry a few swing positions on the side. Keeping both in the same journal, split by strategy, finally told me which side of my trading was actually making money.”
“I keep notes on every stock and mutual fund I hold, why I chose it and what I expect from it. When something underperforms, I can check whether my original reasoning still makes sense instead of just reacting to the price.”
One plan. Three ways to pay.
Full journal, analytics and reports on every plan. Pay less per month the longer you commit.
Flexible, pay as you trade.
- Unlimited trade journal entries
- Performance, strategy and behavioral analytics
- Trading calendar with monthly and yearly summaries
- Broker statement imports
- CSV exports and printable reports
Best value for the long haul.
- Unlimited trade journal entries
- Performance, strategy and behavioral analytics
- Trading calendar with monthly and yearly summaries
- Broker statement imports
- CSV exports and printable reports
Save a little, commit a little more.
- Unlimited trade journal entries
- Performance, strategy and behavioral analytics
- Trading calendar with monthly and yearly summaries
- Broker statement imports
- CSV exports and printable reports
Prices in INR. Cancel any time, access runs to the end of your paid period. All payments final.
Questions traders ask before they start.
TracMetrics is a trading journal and analytics platform. You log your trades and it turns that history into performance, strategy and behavioral analytics.
Retail and active traders across NSE equity, F&O, MCX and crypto who want to understand their own performance rather than rely on memory.
Net P&L, win rate, profit factor, expectancy, drawdown, strategy performance, behavioral analytics and a trading calendar.
Yes. Every workspace is isolated at the data layer, and you can export or delete your data whenever you choose.
A single plan with full access, billed monthly, quarterly or yearly. See the pricing section above for current rates.
Stop Guessing. Start Measuring.
Build a trading process backed by your own data, not by what you remember about last month.